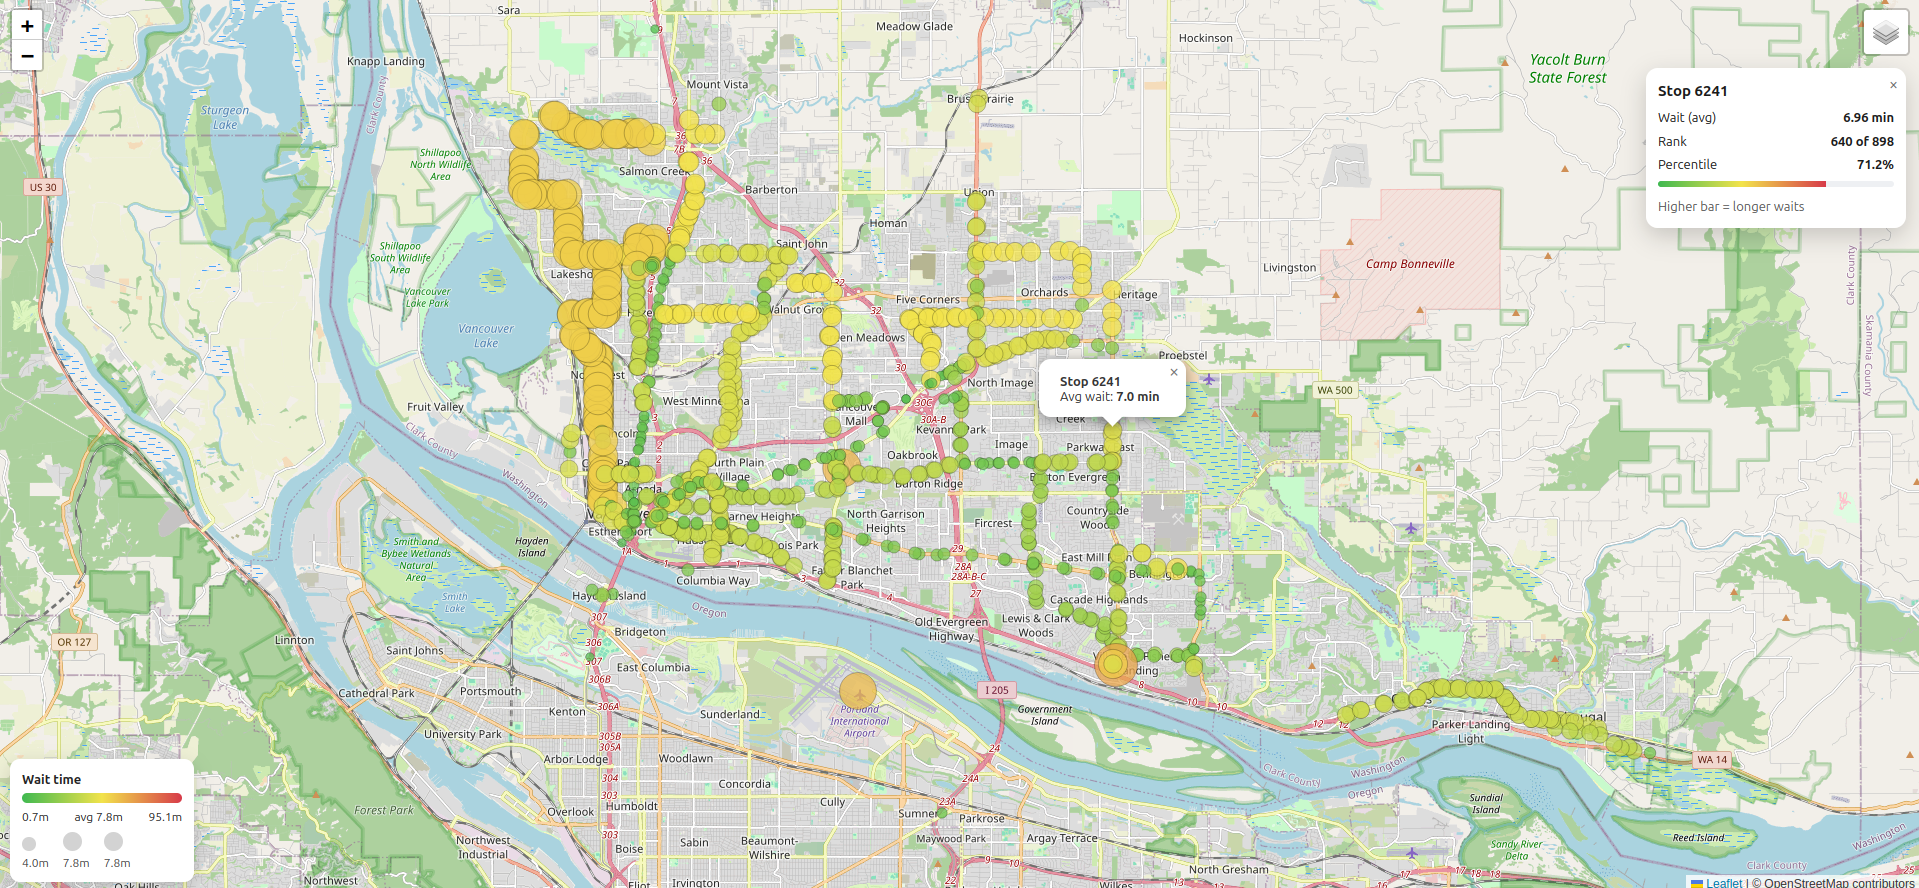
An interactive map visualizing average passenger wait times at C-TRAN bus stops in Vancouver, Washington, calculated from publicly available GTFS schedule data.
This project turns raw GTFS data into a stop-level dataset and interactive map. The Python script loads stops.txt and stop_times.txt, normalizes GTFS times that roll past midnight, converts them to datetimes and sorts by stop_id and arrival time.
For each stop it computes the gap to the next arrival, averages those stretches to estimate typical rider wait in minutes, joins in latitude/longitude from stops.txt and writes a compact wait_time_per_stop.csv for mapping and analysis.
The HTML page renders that CSV file onto a Leaflet base map with a D3 overlay. Each stop appears as a scalable bubble whose size and color encode average wait, with fast, debounced re-projection on pan and zoom. Hover tooltips show stop ID and wait; clicking opens an info panel with exact wait, rank, percentile and a meter bar. A built-in legend also summarizes the color ramp and bubble sizes.